How to create a dashboard on monday.com
What is a dashboard in monday.com?
Dashboards on monday.com display all your important data from multiple boards in a visual way, allowing users to get a high-level overview of key information such as projects and reports. The best part about monday.com dashboards? There are endless possibilities!
From shared dashboards displaying marketing metrics to private dashboards summarising your workload, you can design and utilise your dashboards however you wish.
Here are some ways you can utilise monday.com dashboards:
- Personal dashboard to see an overview of all your upcoming projects
- Shared calendar to view what projects are due and when
- Reporting dashboard to view analytics on vibrant charts and graphs
- Updates dashboard that displays all comments and updates in one location
- Manager dashboard to keep track of your team’s workload and projects
Keep reading as we walk you through how to create a dashboard in monday.com from scratch.
1. Add a dashboard to your workspace
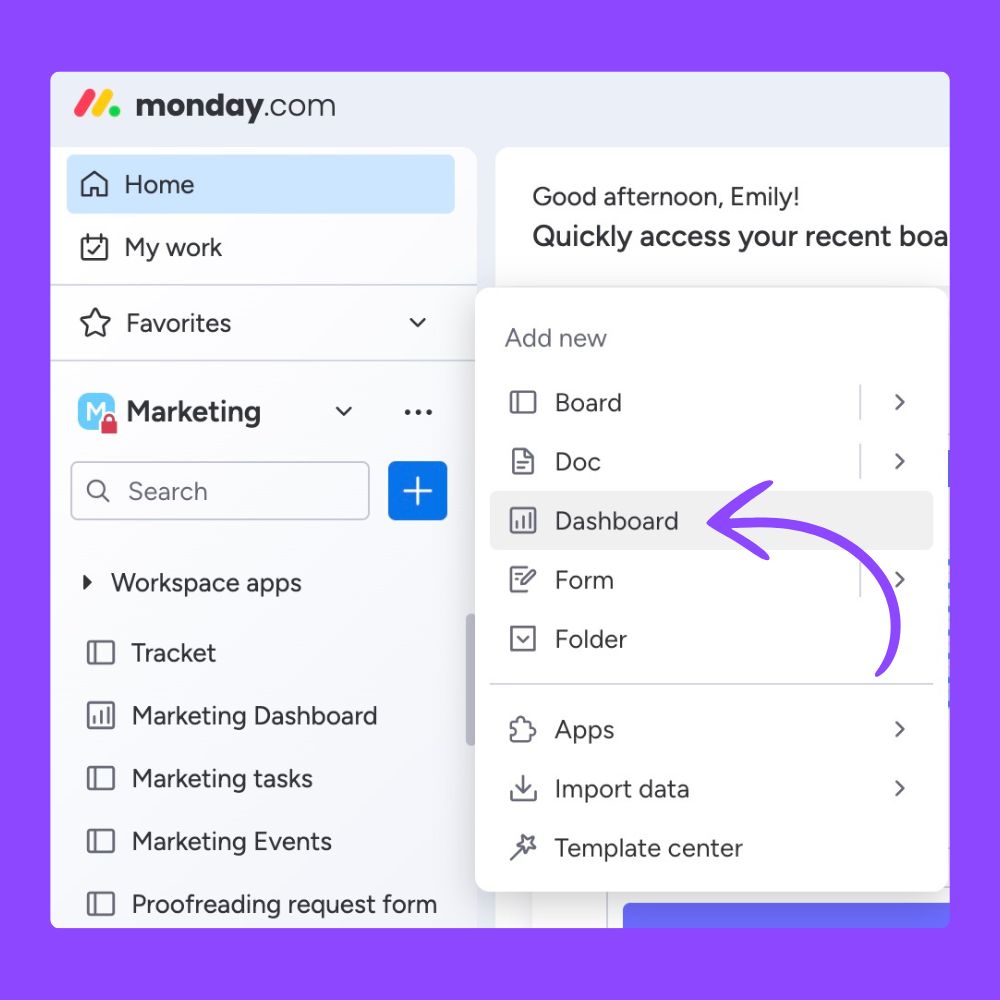
To add a dashboard to your monday.com account, press the blue plus button on the left-hand side and select “Dashboard”.
Next, name your new dashboard and choose the privacy settings. If you want the dashboard to be visible to everyone in your account, choose “Main”. However, if you’re creating a personal dashboard for individual use only, select “Private” to restrict visibility.
2. Connect your boards
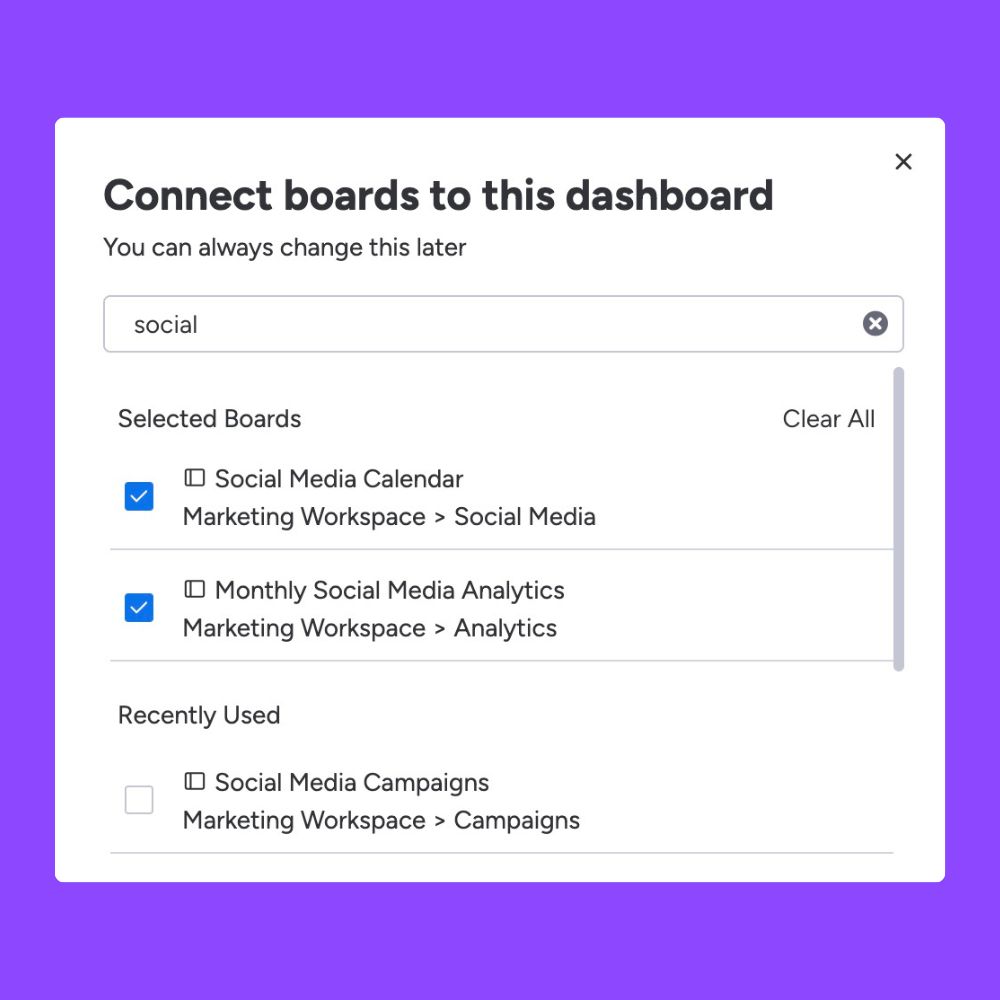
Connecting your boards is how monday.com pulls data into your dashboard. In the image example above, we’re creating a social media analytics dashboard, so we’re connecting our Social Media Analytics and Social Media Calendar boards.
The number of boards you can add to your dashboard depends on the monday.com plan you’re using. If you’re on the Enterprise plan, you can add up to 50 boards to your dashboard!
3. Add your widgets
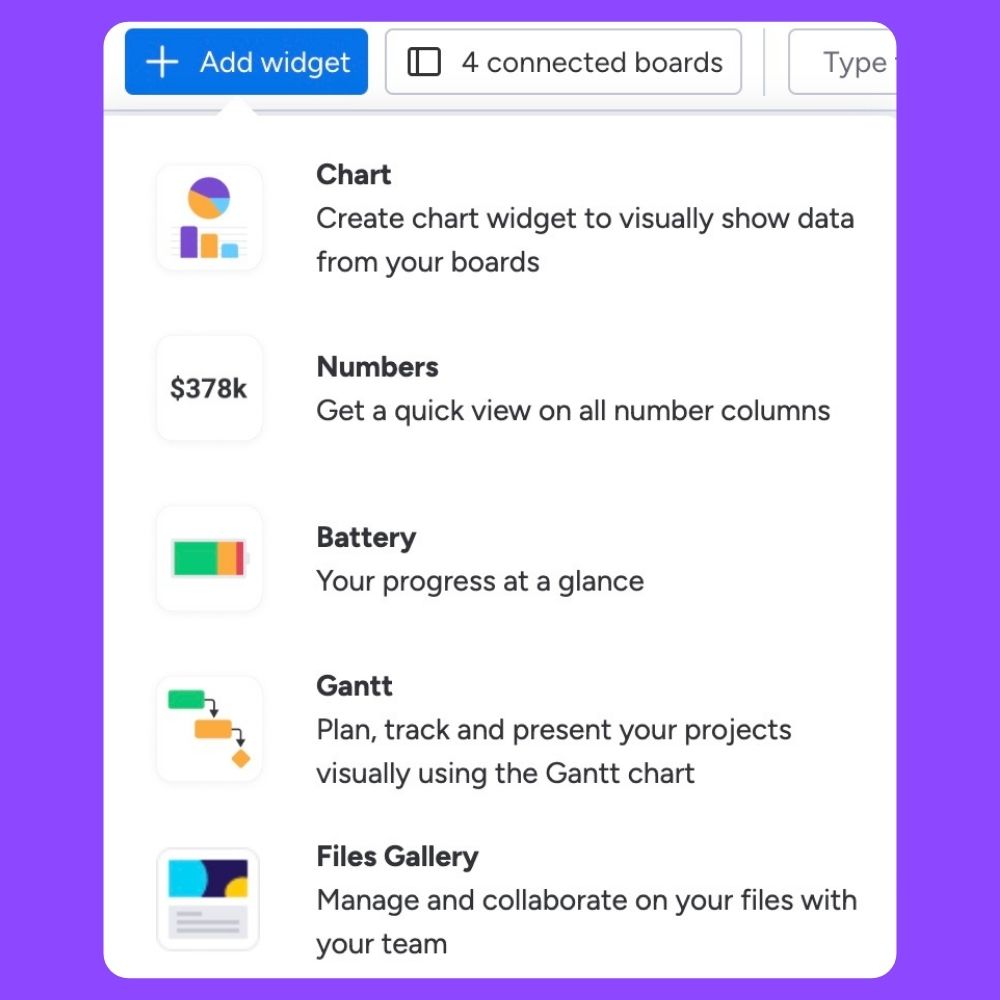
There are hundreds of widgets available in monday.com, but it all depends on your dashboard’s purpose. For example, if you’re creating a sales reports dashboard, you might want to choose widgets like charts and numbers. Or, if you’re creating a personal dashboard to stay on top of projects, you’ll want to choose widgets like workload, battery and calendar.
Let’s go through some of our favourite widgets on monday.com dashboards:
Chart Widget
If you’re creating a dashboard to display anything from marketing analytics to sales pipelines, the chart widget offers various options to present your data in an interactive and colourful graph or chart.
Battery Widget
Just like monitoring your phone’s battery health, keeping track of your project health is important! The battery widget in monday.com displays the status of all your tasks from selected boards, showing how much you’ve completed with a helpful percentage.
Gantt Chart Widget
The Gantt Chart widget displays all your tasks and project timelines in chronological order, making it easy to follow and perfect for those wanting to manage their individual or team workload.
Learn more about how to create and customise Gantt Charts on monday.com in our blog.
Workload Widget
Maybe you’re overwhelmed with incomplete projects or want to assign tasks to your team without overloading them. The Workload Widget provides a visual way to see your team’s workload at a glance. It will show you how many projects they have and when they are due, so you can ensure everything is evenly distributed. Alternatively, it also shows effort against a singular project to distribute resources appropriately if multiple members of your team are assigned to the same tasks or projects.
Calendar Widget
It’s exactly what it says on the box! The Calendar Widget displays all your connected board’s tasks on a visually appealing calendar, allowing you to see deadlines, upcoming projects and align with fellow team members. Plus, the Calendar Widget in monday.com can integrate with Outlook and Gmail. We dive into the Calendar View in our blog.
4. Edit your widgets
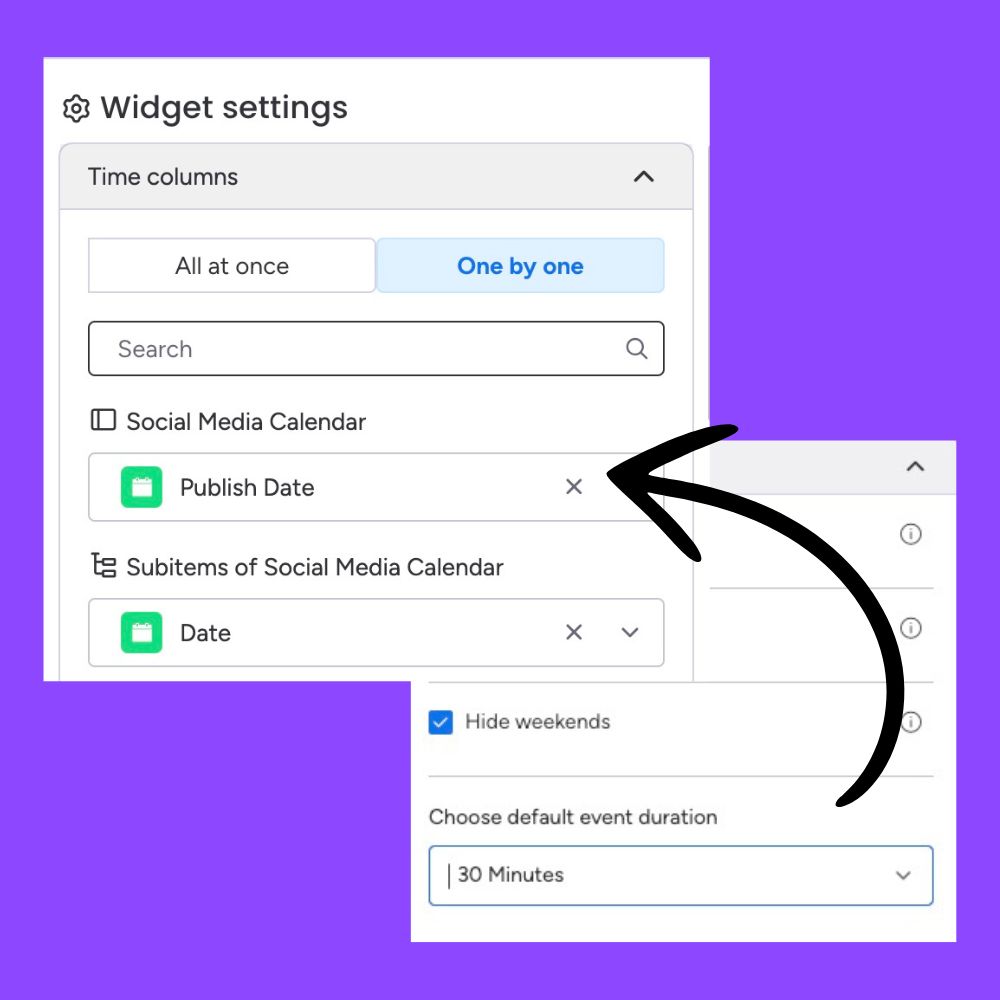
When you add your widgets, you’ll notice they’re set as a preset and may need some further customising. For example, you might want certain widgets connected to certain boards, while others connect to different boards. When you open the “Settings” for each widget, you can select which board they pull data from and which boards they don’t.
Charts and numbers widgets can be edited to show only the analytics you want to see. You can also edit Gantt charts and calendar views to display specific information. Each widget is different, but there’s plenty to edit before your dashboard is complete.
5. Share your dashboard
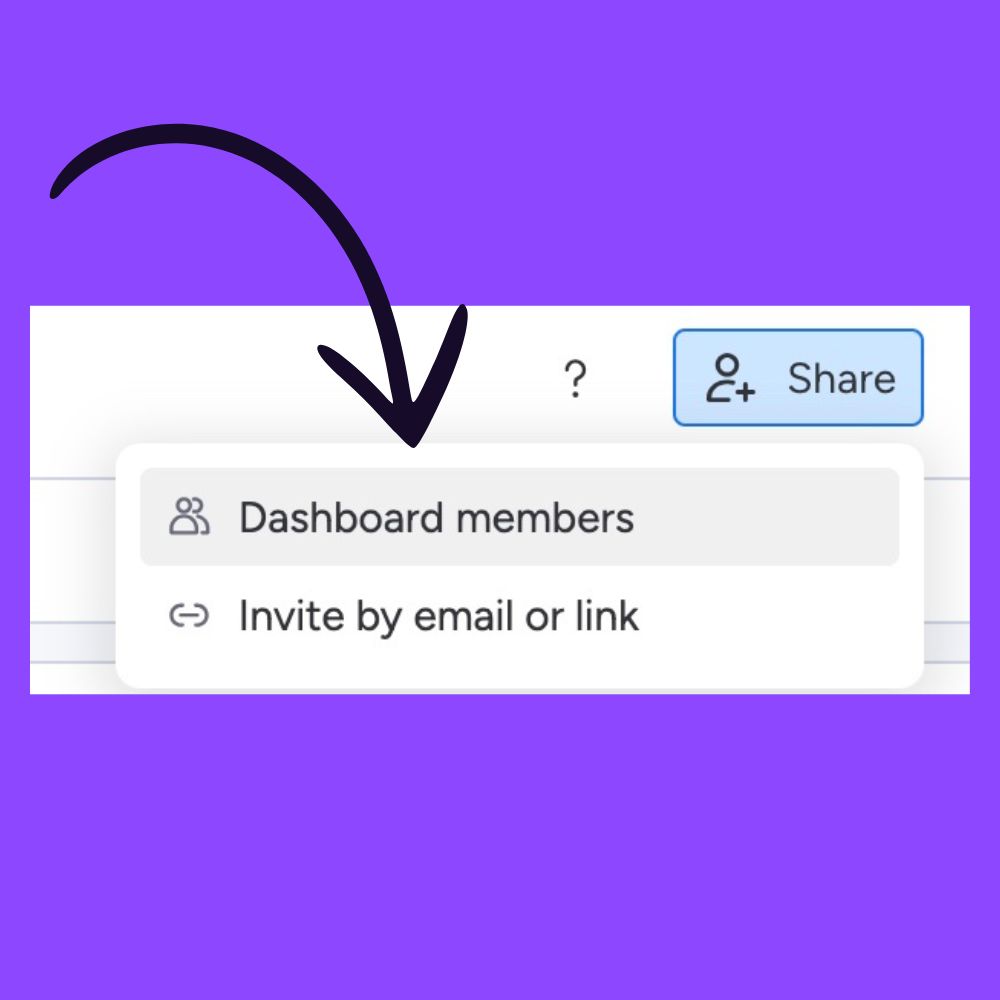
If you’re creating a private dashboard just for yourself, you’ll want to skip this step. However, if you want your dashboard to be shared with your team, make sure to change the edit access so your team can add their own widgets and data.
To do this, press “Share” in the top right-hand corner and add teammates. If you want certain team members to be able to edit the dashboard, make them board owners by pressing the crown button. If your dashboard was set to “Main” on the first step, your workspace members will be able to view it!
Want more help with dashboards or monday.com in general? Contact our consultants for a free demo or consultation.


